
Market Breadth Signal · SPY
When Markets Warn Before They Fall
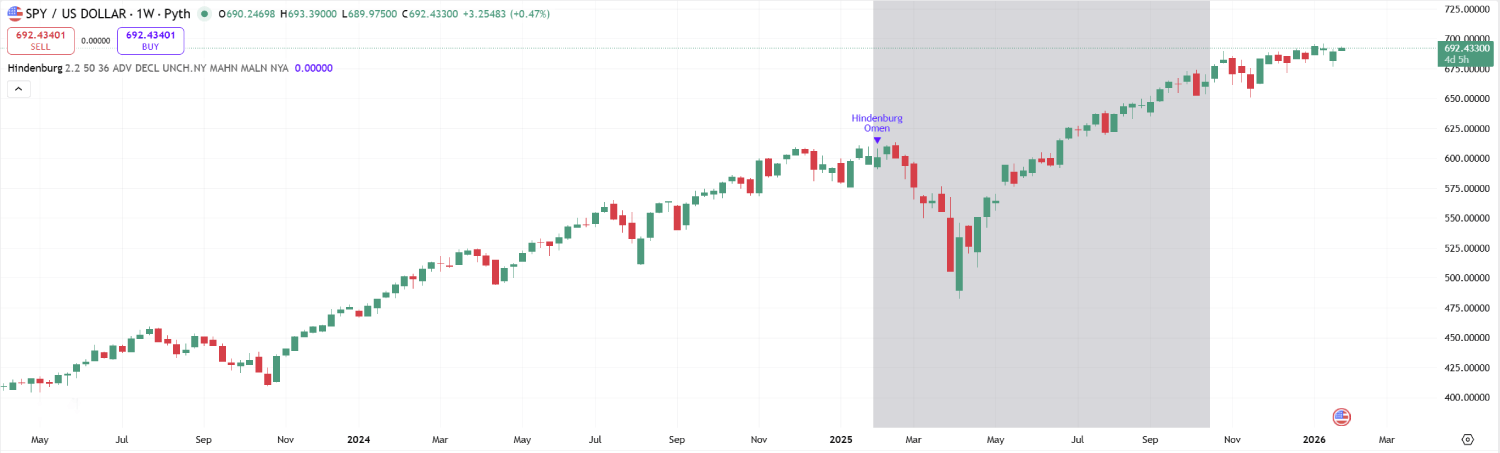
The Hindenburg Omen is one of the rarest signals in technical analysis. It doesn’t track price. It tracks what’s breaking beneath price. And when all five conditions align, experienced traders pay close attention.
By the numbers
Why This Signal Commands Respect
What the signal detects
Three Things Happening at Once
The Omen fires only when the market shows all three signs of internal fracture at the same time. That’s what makes it rare.
Surge in New Highs
A significant number of NYSE stocks are simultaneously hitting 52-week highs, a sign that some parts of the market are still running hot.
Surge in New Lows
At the same time, a nearly equal number of stocks are hitting 52-week lows. A healthy market doesn’t do both at once.
Fractured Participation
The index price may look calm, but leadership is broken. The breadth of participation has quietly collapsed, a classic precursor to volatility.
The market looks perfectly fine on the surface, while internally something is breaking. That’s exactly when the Hindenburg Omen speaks up.
Track it yourself
Add It to Your SPY Chart in 2 Steps
Open the SPY chart & search for the indicator
Click the button below to open the live SPY chart, then click Indicators at the top and type Hindenburg Omen. It’s a built-in TradingView indicator, no installs needed.
Open SPY Chart on TradingView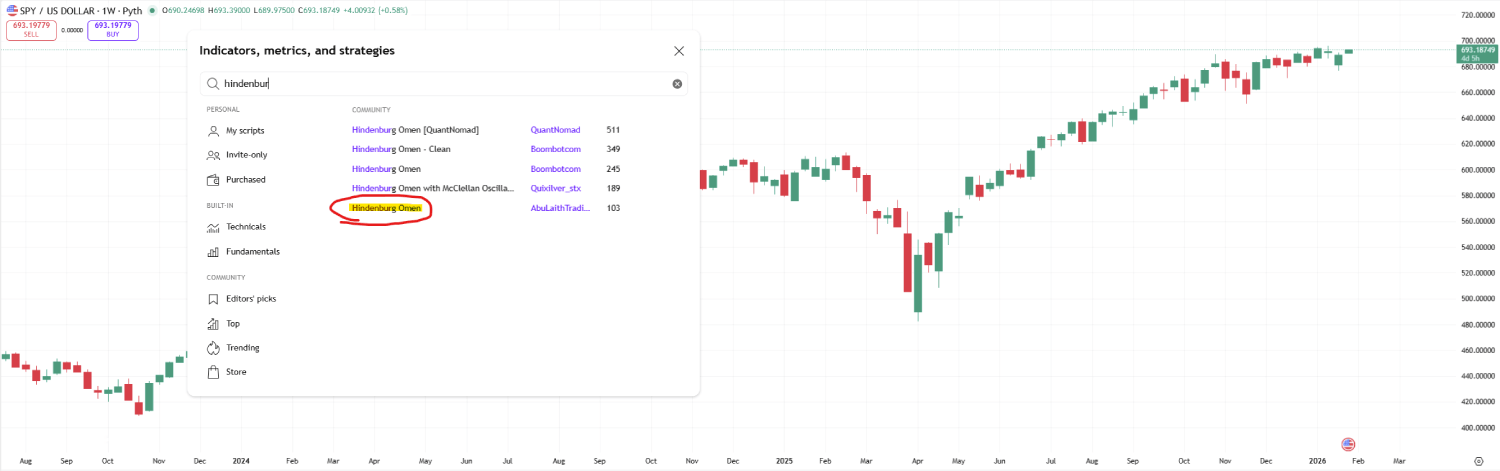
Click to add & optionally fine-tune settings
One click applies it instantly. In Settings you can adjust threshold sensitivity, the lookback period, breadth data sources, and signal window shading. Most traders leave the defaults.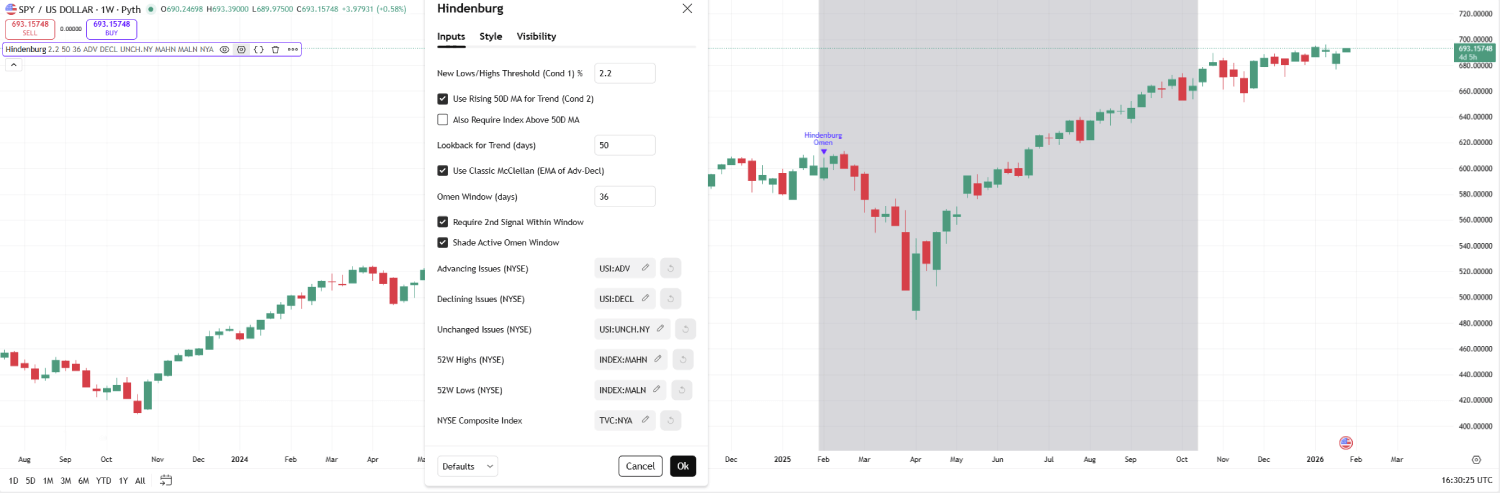
The broader picture
One Signal Is Never Enough. HedgeHawk Monitors Them All.
The Hindenburg Omen is one piece of the puzzle. HedgeHawk’s live risk dashboard tracks dozens of market signals: breadth, volatility, sentiment, credit spreads, and Put/Call ratios, so you always see the full picture before it moves.
Open Live Dashboard- Daily VIX, VIX3M & SKEW monitoring
- Put/Call ratio with trend context
- Credit spread & yield curve alerts
- SOFR & money market stress indicators
- Daily market summary
Ready to act on what you know?